Power BI
Data Visualization and Business Intelligence at its best
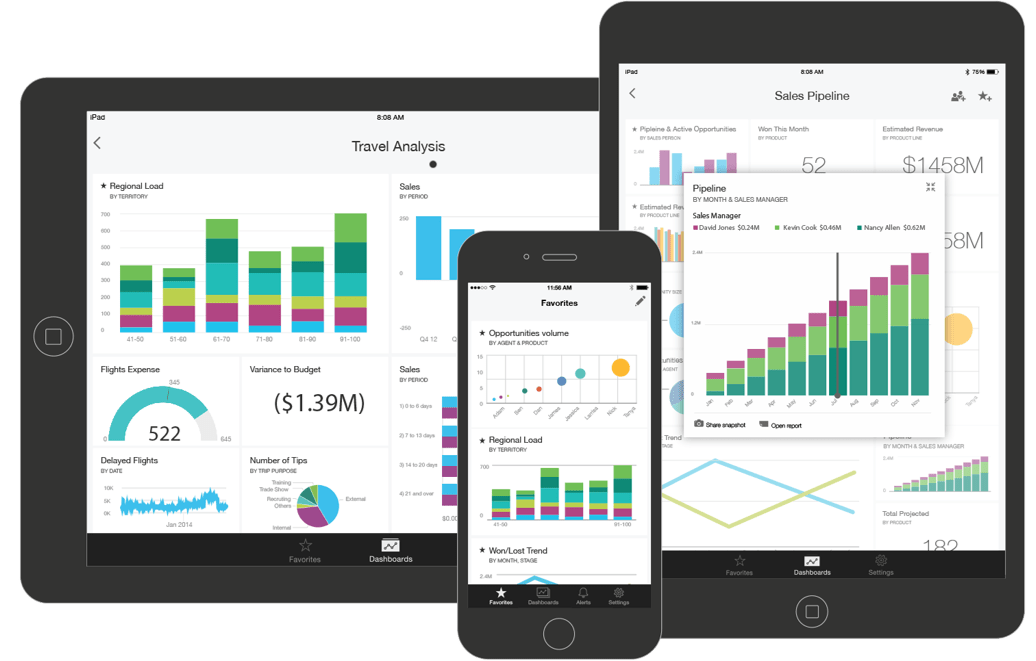
Power BI is a powerful business intelligence (BI) tool that empowers organizations to transform raw data into interactive visualizations, reports, and dashboards. With its user-friendly interface and robust features, Power BI enables users to make informed decisions and gain valuable insights from their data.
Product Highlights
Power BI offers a wide range of product highlights that make it a standout business intelligence tool. At its core, Power BI is designed to connect to a wide range of data sources, including databases, cloud services, and online platforms, allowing users to consolidate data from various systems into a single unified view. This capability enables organizations to break down data silos, uncover hidden patterns, and identify correlations that may otherwise go unnoticed.
The strength of Power BI lies in its data modeling and transformation capabilities. Users can perform complex data transformations, such as data shaping, cleansing, and merging, without the need for extensive coding or technical expertise. The intuitive Power Query Editor provides a visual interface for these tasks, making it easy for users to clean and prepare their data for analysis.
LTS Empowers Organizations with Power BI
Customized Dashboards: LTS allows users to create customized dashboards with a wide range of visualization options. Users can personalize their dashboards by selecting specific visualizations, arranging them according to their preferences, and applying custom formatting.
Data Integration: LTS facilitates the seamless integration of data from various sources. It can connect to a wide range of data sources, including databases, cloud services, spreadsheets, and more. Users can easily combine and transform data from different sources to create a unified view for analysis.
Advanced Analytics: With its integration with Microsoft Azure, Power BI offers advanced analytics capabilities. Users can leverage machine learning algorithms, statistical models, and predictive analytics to gain deeper insights from their data. These advanced analytics features enable businesses to uncover patterns, and trend ends, and make data-driven predictions.
Data Visualization: LTS provides a comprehensive set of data visualization tools. Users can create visually appealing and interactive charts, graphs, maps, tables, and more. The drag-and-drop functionality allows for easy exploration and analysis of data, making it easier to identify patterns, trends, and relationships.
Real-time Data Monitoring: LTS enables real-time data monitoring and analysis. Users can connect to live data sources and set up automatic data refresh schedules.

